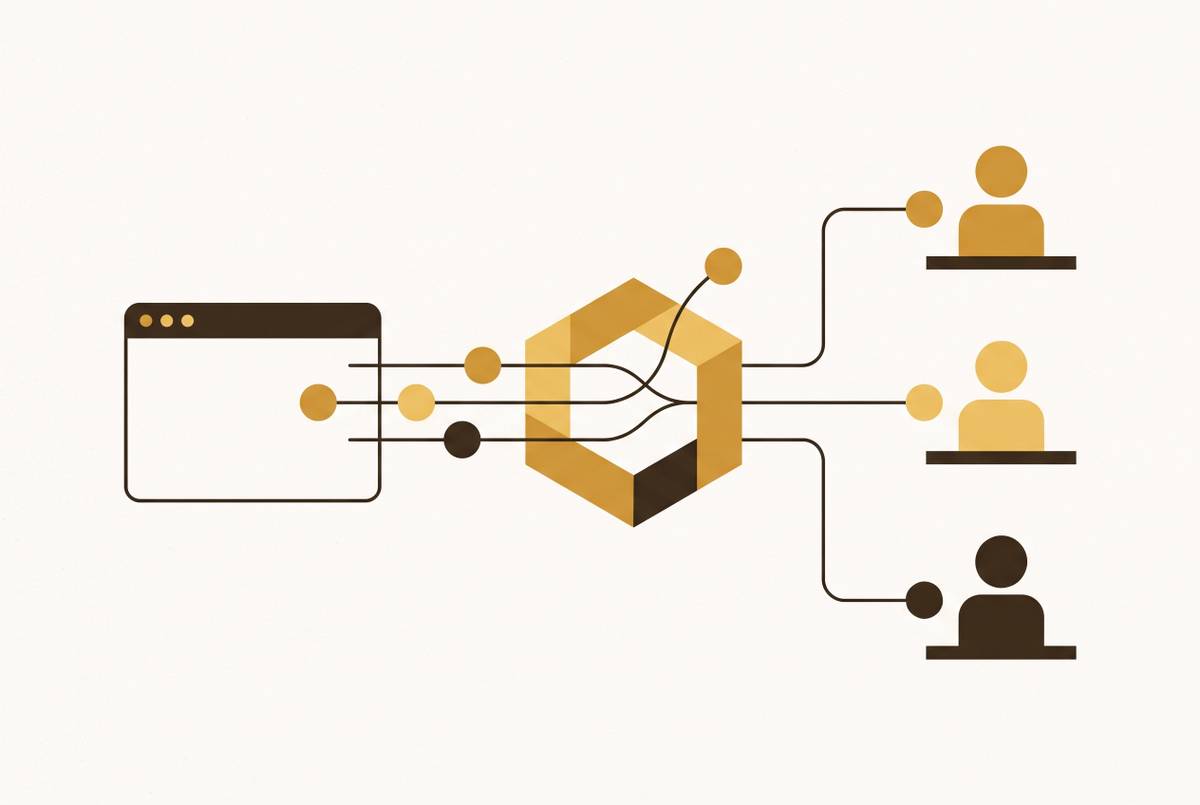
Conversion Rate Optimization for B2B SaaS Demo Request Pages
A stronger pipeline beats higher submissions when demo requests convert to qualified opportunities.
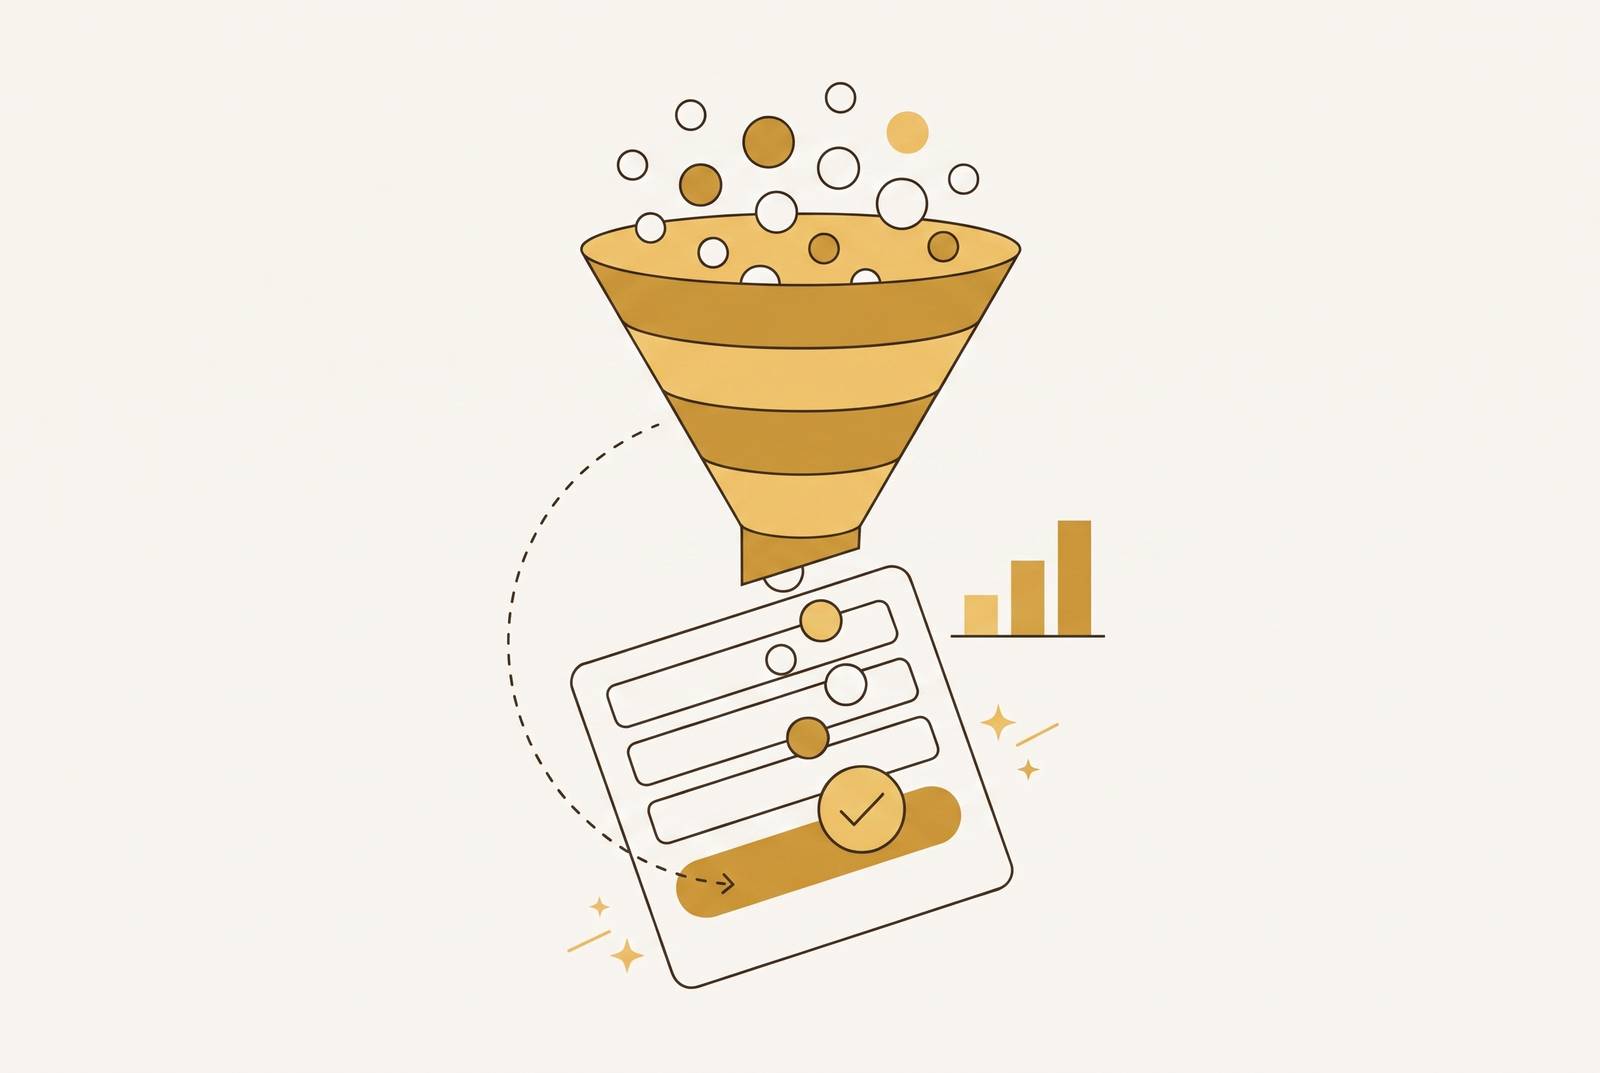
Conversion rate optimization for B2B SaaS demo request pages requires work on the pipeline as well as page design. Page signals, form friction, qualification logic, and response speed work as one connected system. The useful measure of an improvement is whether it produces more qualified opportunities and closed revenue, rather than more submissions that disappear before sales can convert them.
Why optimizing only the demo request page is not enough
A visitor’s decision to request a demo is only the first conversion in a longer sequence. The request must lead to a booked meeting, the meeting must happen, and qualification must show whether the prospect belongs in the sales pipeline. Each transition has a different driver. Page design influences submission, response speed influences booking, and qualification logic influences the share that becomes sales-qualified leads, or SQLs.
These dependencies make local improvements economically fragile. More submissions do little good if the added leads wait too long to hear from sales or cannot meet the sales team’s qualification criteria. Stronger qualification, in turn, can bring more from the pipeline even when fewer visitors fill out the form. A lower page conversion rate is not necessarily a worse result.
Moving from the low end to the midpoint of paid-search demo-request benchmarks can match the pipeline impact of doubling monthly ad spend. That comparison depends on the gain surviving downstream. The full path therefore has to be evaluated before a page-level result can justify a spending decision.
What the 2026 benchmarks actually measure and where most teams are reading them wrong
The 2026 benchmark framework distinguishes offers that ask visitors to make different commitments. Self-serve and product-led growth signup pages have a meaningfully higher median conversion rate than sales-assisted pages, with best-in-class pages performing higher still. Demo-request pages have lower rates, though high-touch experiences and clear qualification bring them toward the top of that range. Top-of-funnel content pages have the lowest medians of the three types.
A page with a higher submission rate and weak demo-to-SQL performance can produce fewer SQLs than a lower-converting page with strong qualification. The denominator is only half the story. Optimizing submissions alone can favor low-ACV, low-quality volume over prospects that fit the sales motion.
Brand-search visitors and cold social visitors can respond very differently to the same page without any change in its design. A blended average obscures that difference. It can make a change in acquisition mix look like a conversion improvement or make a sound page appear to underperform.
For practitioners, the implication is to separate benchmarks by traffic source and sales motion before running a CRO experiment. The comparison then shows whether similar visitors who are weighing a similar offer move to the next step at a different rate. Once that comparison exposes a submission gap, the next question is which page signals are failing to turn existing intent into action.
Page-level signals that determine whether a visitor converts or leaves
A demo-request page has seconds to establish value and trust. The hero section is the first test, often before a visitor sees the form. If it does not make the offer relevant, improvements farther down the page may never receive attention.
Logo bars, G2 badges with star ratings and review counts, and a short customer quote with a name and title can reduce hesitation when placed next to the primary CTA. Placement connects evidence to the decision it supports. Verifiable proof also gives visitors a basis for trust beyond the page’s own claims, with embedded live review feeds from G2 and Capterra linking to reviewer profiles.
Letting visitors see the product can also build trust before qualification begins. UpperHand replaced its “Request a Demo” CTA with an ungated interactive tour built on Navattic, reducing bounce rates and increasing demo requests. The change let visitors inspect the product before committing. It illustrates how a page can strengthen the eventual request by asking for less at the first interaction.
A dual-CTA model applies that distinction to visitors with different levels of readiness. “Take a Tour” gives exploratory researchers a route to understanding, while “Book a Demo” preserves a direct path for high-intent buyers. The tour acts as a self-qualification layer. In that sequence, the subsequent form follows demonstrated value rather than demanding information before the visitor understands the offer.
Personalization strengthens relevance by adapting headlines, proof, and CTA copy to traffic source, company data, industry, or job role. Brand-search, competitor-conquesting, and category-education traffic do not arrive with the same questions, so separate acquisition pages support both conversion and cleaner benchmarking. Page relevance, however, cannot remove every barrier. Even a convincing offer can lose the visitor when the form asks for more effort than the expected value warrants.
How form design determines the quality and quantity of what reaches sales
A short form leaves more screening to the SDR, while a longer form filters prospects before their details reach sales. Neither choice is neutral. The right design depends on the sales motion and the cost of passing poorly qualified requests downstream.
For most mid-market motions, the recommended starting point is name, work email, company, and one qualifying question. More visitors may finish shorter forms, but sales gets less information, while fields such as job title, company size, and use case lead to fewer submissions and a higher SQL rate. For high-ACV enterprise motions, that exchange can be correct because raw volume is not the objective.
A bootstrapped HR Tech SaaS case illustrates the value of matching the form to the motion. A dedicated demo-request page with a single headline, two trust logos, and a three-field form moved conversion to over 3% within six weeks. The combined result shows that the form belongs to the page’s overall demand on the visitor.
Mobile makes that demand more acute. Perspective AI’s 2026 analysis reports that free-text “Tell us about your use case” fields are abandoned by nearly three-quarters of mobile visitors. Such a field requires both thought and typing. The burden falls at the moment a prospect is deciding whether to act, making what visitors must supply as consequential as the number of fields.
Conversational AI intake offers a different allocation of that work. Instead of presenting every field at once, an agent asks qualifying questions in sequence, gathers context, and routes the lead in real time. Perspective AI’s report says companies reported two to four times the qualified pipeline for the same ad spend after they replaced multi-field demo-request forms with AI intake. The return from changing the interface remains uncertain.
The structural advantages go beyond a chat-style presentation. A conversational system can ask follow-up questions about why a prospect gave an answer, resume the exchange after a tab switch, and route the prospect toward PLG self-serve, an SDR queue, or direct AE booking. Static forms offer a different strength. They produce predictable structured fields, while conversational intake raises concerns about inconsistent CRM data and AI reliability, particularly for enterprise buyers with strict compliance requirements.
Well-designed conversational systems can extract the same structured fields while retaining richer context, but that capability does not remove the need for sound implementation. The choice remains motion-dependent. The report describes a Series B PLG developer tool that replaced its demo form with self-serve signup for individuals and conversational intake for teams of 10+. This separates buyers by the assistance they need, but either route still depends on what happens when a prospect is ready for contact.
Why response speed after form submission loses more pipeline than a low-converting form
The interval between submission and first human contact can erase the value created by the page and form. When follow-up is delayed, the funnel has acquired a prospect without completing the handoff. This makes response speed a recoverable loss point that page conversion metrics cannot expose.
LeanData’s case study describes how Zendesk cut lead response time to single-digit minutes and did much less lead assignment work by hand. The two improvements belong to the same process. Faster contact was connected to less manual routing, rather than depending only on an SDR deciding to respond sooner. The case places response speed within process architecture, where assignment and contact have to work together.
That distinction changes how a slow response should be interpreted. A queue awaiting manual assignment is not simply a rep-performance problem, and a fast acknowledgment is not equivalent to a completed handoff. Routing quality and speed have to reinforce each other. Otherwise, the system can reply quickly without bringing the prospect closer to the right sales conversation.
For buyers who do not self-schedule, AI-powered immediate response can begin engagement in seconds. Perspective AI’s analysis describes agents working at that speed, which makes it harder for companies that are slow to respond to compete. This is a process capability. Its purpose is to close the waiting period between demonstrated interest and the next useful interaction.
The strongest claim is therefore about recoverable waste. A team with weak page conversion and prompt follow-up has a different constraint from one with strong submission volume and slow assignment. Connected measurement distinguishes them. Once meetings are booked and held, the next risk is counting that activity as pipeline without establishing what it produces.
Building the measurement system that connects page visits to closed revenue
A dashboard that tracks demo volume can reward changes that do little to help sales. Without SQL rate, opportunity creation, and closed-won revenue, it cannot distinguish growth in sales potential from growth in screening work. Page conversion remains useful, but it is incomplete. Its interpretation depends on the stages that follow.
The same distinction applies to booked and held meetings. Forecasting from bookings alone hides no-show risk and inflates the apparent pipeline. A booking is a commitment to a future interaction. Measurement has to preserve that difference before attributing downstream value to an experiment.
For experimentation, the recommended scorecard includes page conversion, SQL rate, opportunity creation, average deal size, and close rate. These measures expose whether a gain in one stage survives the next. Bayesian testing supports speed, while frequentist testing is suited to large sample sizes. The testing method cannot rescue an experiment whose success criterion excludes lead quality or revenue outcomes.
The practical audit begins with traffic quality. High bounce and low session depth from paid acquisition signal an intent mismatch. The corresponding action is to reallocate spend toward intent-heavy keywords. This prevents the page team from being asked to compensate for traffic that does not fit the offer.
Page experience forms the next diagnostic layer. Strong scroll depth paired with heatmaps showing low engagement in the CTA area points toward a trust or relevance gap above the fold. Funnel alignment then tests what submissions become. High demo-request volume with low opportunity creation indicates a qualification mismatch, making qualification logic the relevant intervention.
Those distinctions require attribution that connects visits and requests to SQLs, opportunities, and revenue. Without it, each team can report that its work went well even as the funnel loses value when work passes from one team to the next. Measurement makes the connected system legible. The practical next step is to select the stage with the largest gap against a comparable benchmark, fix that stage, and re-measure the downstream stages to establish whether the gain held.